Scoliosis is a medical condition characterized by an abnormal curvature of the spine. It affects millions of people worldwide, with an estimated prevalence of 2-3% in the general population. Scoliosis can occur at any age, but it is most commonly diagnosed during adolescence. Early detection and monitoring of scoliosis are crucial for effective treatment and management of the condition. This is where scoliosis charts come into play.

What is Scoliosis?
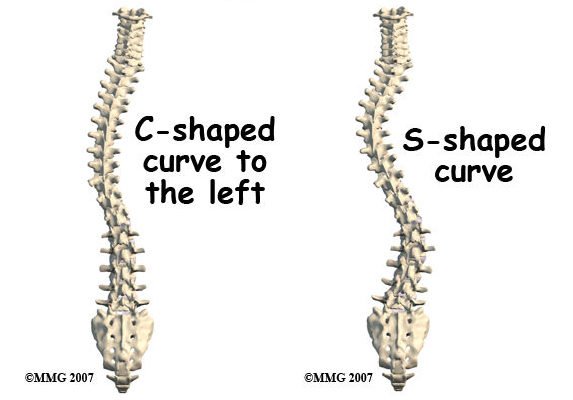
Scoliosis is a condition that causes the spine to curve sideways, forming an “S” or “C” shape. The curvature can range from mild to severe, and it can affect any part of the spine. Scoliosis can be caused by various factors, including genetics, muscle imbalances, and neuromuscular conditions. It can also be idiopathic, meaning that the cause is unknown.

Understanding Spinal Curvature
Spinal curvature refers to the abnormal sideways curvature of the spine that occurs in scoliosis. The curvature can be measured using various methods, including the Cobb angle, which is the most commonly used measurement technique. The Cobb angle measures the angle between the upper and lower vertebrae that are most tilted in the curve.
Importance of Tracking and Analyzing Scoliosis
Tracking and analyzing scoliosis are essential for several reasons. Firstly, it allows healthcare professionals to monitor the progression of the condition over time. This is crucial because scoliosis can worsen rapidly during periods of growth, especially in adolescents. By tracking the curvature using scoliosis charts, doctors can determine the appropriate treatment plan and intervene if necessary.
Secondly, tracking scoliosis helps to assess the effectiveness of treatment. Different treatment methods, such as bracing or surgery, can be used to manage scoliosis. By regularly monitoring the curvature using scoliosis charts, doctors can evaluate whether the treatment is working and make adjustments if needed.
Components of a Scoliosis Chart
A scoliosis chart typically includes several components to accurately track and analyze spinal curvature. These components may include the patient’s personal information, such as name, age, and date of diagnosis. The chart will also include measurements of the Cobb angle at different time points, usually taken from X-rays or other imaging techniques. Additionally, the chart may include notes on the patient’s symptoms, physical examination findings, and any treatment interventions.

Types of Scoliosis Charts
There are various types of scoliosis charts available, ranging from simple paper charts to more advanced electronic systems. Traditional paper charts are often used in clinics and hospitals, where measurements are manually recorded and plotted. Electronic scoliosis charting systems, on the other hand, allow for more efficient data collection and analysis. These systems often include features such as automatic calculation of the Cobb angle and the ability to generate visual representations of the spinal curvature.
How to Use a Scoliosis Chart
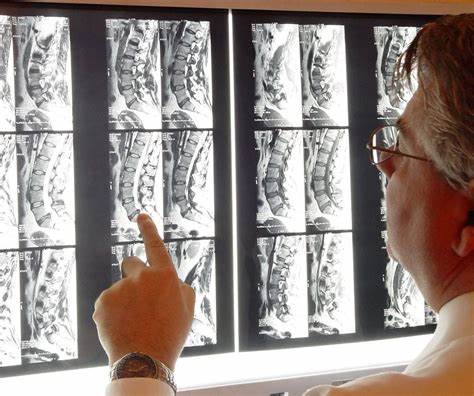
Using a scoliosis chart involves several steps. Firstly, the patient’s personal information is recorded on the chart. Then, the healthcare professional measures the Cobb angle using X-rays or other imaging techniques. The measurements are then recorded on the chart, along with any relevant notes or observations. This process is repeated at regular intervals to track the progression of the scoliosis. The chart can be used as a visual aid to monitor changes in the curvature over time.
Interpreting Scoliosis Chart Data
Interpreting scoliosis chart data requires a thorough understanding of the condition and the measurement techniques involved. The Cobb angle measurements are the primary data points used to assess the severity of the scoliosis. A Cobb angle of less than 10 degrees is considered normal, while an angle of 10-25 degrees is classified as mild scoliosis. Moderate scoliosis is defined as an angle of 25-40 degrees, and severe scoliosis is characterized by an angle greater than 40 degrees.
Benefits of Using Scoliosis Charts
The use of scoliosis charts offers several benefits in the management of the condition. Firstly, they provide a visual representation of the spinal curvature, allowing healthcare professionals to easily track changes over time. This visual aid can help patients and their families better understand the condition and the effectiveness of treatment interventions.
Secondly, scoliosis charts facilitate communication between healthcare professionals and patients. By documenting the measurements and treatment interventions on the chart, all parties involved can have a clear understanding of the patient’s progress and the next steps in their care.
Furthermore, scoliosis charts enable researchers to analyze large datasets and identify trends or patterns in the progression of the condition. This can lead to advancements in treatment methods and improve patient outcomes.
Limitations of Scoliosis Charts
While scoliosis charts are a valuable tool in the management of the condition, they do have some limitations. Firstly, the accuracy of the measurements depends on the skill and experience of the healthcare professional performing them. Variations in measurement techniques can lead to inconsistencies in the recorded data.
Secondly, scoliosis charts only provide a snapshot of the patient’s condition at specific time points. They do not capture the dynamic nature of scoliosis, which can change rapidly during periods of growth. Therefore, regular monitoring and follow-up appointments are necessary to accurately track the progression of the condition.
Scoliosis Charting Techniques
There are several techniques used to chart scoliosis, with the Cobb angle being the most widely used. The Cobb angle is measured by drawing lines along the endplates of the most tilted vertebrae in the curve. The angle formed between these lines is then measured using specialized software or manual techniques.
Other charting techniques include the Risser-Ferguson method, which assesses skeletal maturity, and the Lenke classification system, which categorizes scoliosis based on the location and characteristics of the curve. These techniques provide additional information that can aid in treatment planning and decision-making.
Future Developments in Scoliosis Charting
Advancements in technology are likely to shape the future of scoliosis charting. Electronic charting systems are becoming increasingly popular, allowing for more efficient data collection and analysis. These systems may incorporate artificial intelligence algorithms to automatically calculate the Cobb angle and detect changes in the spinal curvature.
Furthermore, wearable devices and mobile applications may be developed to enable patients to track their scoliosis at home. These devices could provide real-time feedback and alerts, allowing for early intervention and improved patient outcomes.
In conclusion, scoliosis charts are essential tools in the management of the condition. They allow healthcare professionals to track and analyze spinal curvature, monitor treatment effectiveness, and communicate with patients and their families. While scoliosis charts have limitations, advancements in technology and charting techniques offer promising opportunities for improved monitoring and treatment of scoliosis in the future.
References
- Weinstein SL, Dolan LA, Cheng JC, et al. “Adolescent idiopathic scoliosis.” Lancet. 2008;371(9623):1527-1537. doi: 10.1016/S0140-6736(08)60658-3.
- Negrini S, Donzelli S, Aulisa AG, et al. “2016 SOSORT guidelines: Orthopaedic and rehabilitation treatment of idiopathic scoliosis during growth.” Scoliosis and Spinal Disorders. 2018;13:3. doi: 10.1186/s13013-018-0175-8.
- Trobisch P, Suess O, Schwab F. “Idiopathic scoliosis.” Dtsch Arztebl Int. 2010;107(49):875-883. doi: 10.3238/arztebl.2010.0875.
- Hresko MT. “Clinical practice. Idiopathic scoliosis in adolescents.” N Engl J Med. 2013;368(9):834-841. doi: 10.1056/NEJMcp1209063.
- Bettany-Saltikov J, Weiss HR, Chockalingam N, et al. “Surgical versus non-surgical interventions in people with adolescent idiopathic scoliosis.” Cochrane Database Syst Rev. 2015;2015(4). doi: 10.1002/14651858.CD010663.pub2.
- Social Security Administration. “Disability Benefits.” https://www.ssa.gov/benefits/disability/.
- Lonstein JE, Carlson JM. “The prediction of curve progression in untreated idiopathic scoliosis during growth.” J Bone Joint Surg Am. 1984;66(7):1061-1071. doi: 10.2106/00004623-198466070-00008.
- Kaspiris A, Grivas TB, Weiss HR, Turnbull D. “Scoliosis: Review of diagnosis and treatment.” International Journal of Orthopaedics. 2013;37(1):34-42. doi: 10.1038/s41390-020-1047-9.
- Monticone A, Ambrosini A, Cazzaniga D, Rocca B, Ferrante S. “Effectiveness of a multimodal treatment for scoliosis in adolescents: a randomized controlled trial.” BMC Musculoskelet Disord. 2018;19(1):310. doi: 10.1186/s12891-018-2234-4.
